Week 8 - Crime mapping near Schools.
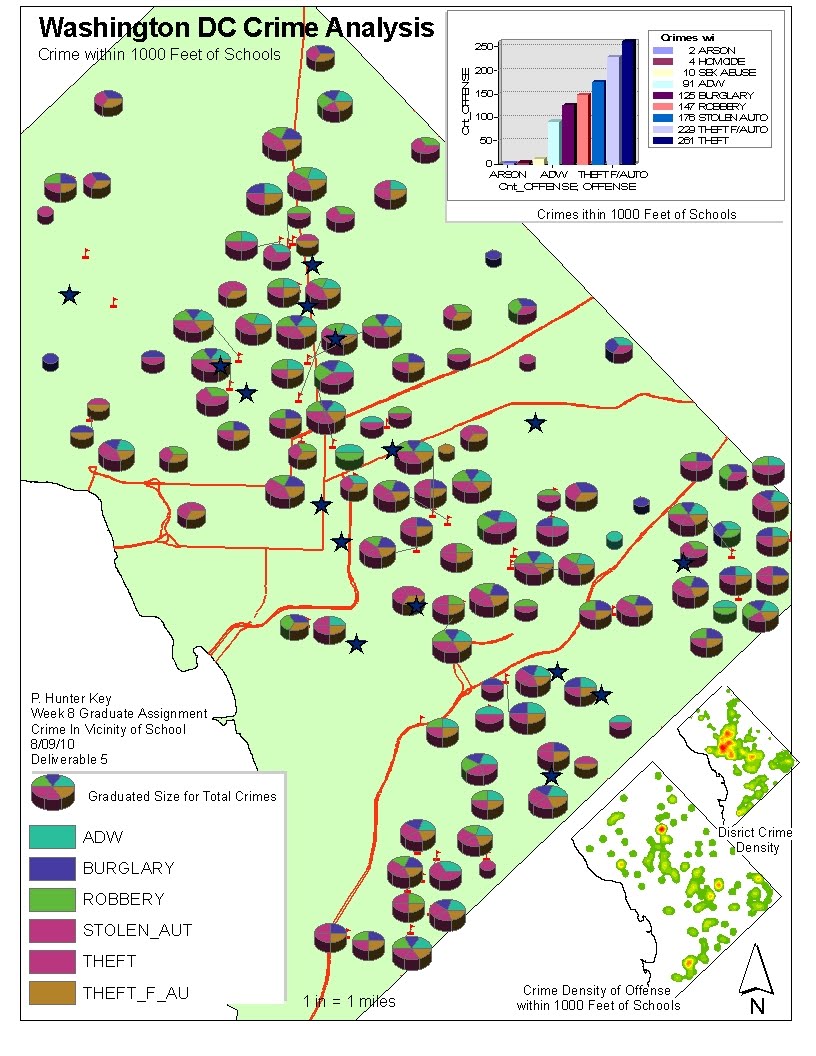
Method: 1000 foot buffers of schools to display crimes. Crimes were then spatially joined to the schools and then a pivot table was created and joined back to the school layer. This provided the school, type of crime, # of those crimes and total crimes occured near the school. This feature class was then used to create gradient pie chart symbology to distinguish the volume of crime in size and the break down by offense. The graph at the top provides the breakdown of crimes in school zones, and the lower right maps show density of total crimes and crimes near schools.
No comments:
Post a Comment